Astrology Graph
To toggle the astrology graph you can click the button at the top of the astrology chart or press while focused on one of the astrology inputs. You can also open a graph from the dates accordion section of the astrology panel, by an aspect on the astrology chart or the astrology chart aspects table or by the sign in the planets table.
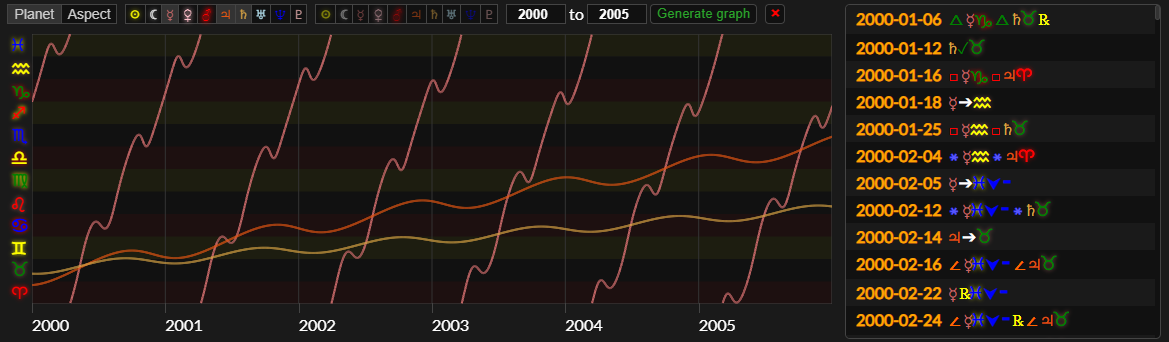
There are two types of graph. The first one is the graph which will show the path of selected planets through the zodiac over time. This is useful for seeing when planets change signs or station direct or retrograde.
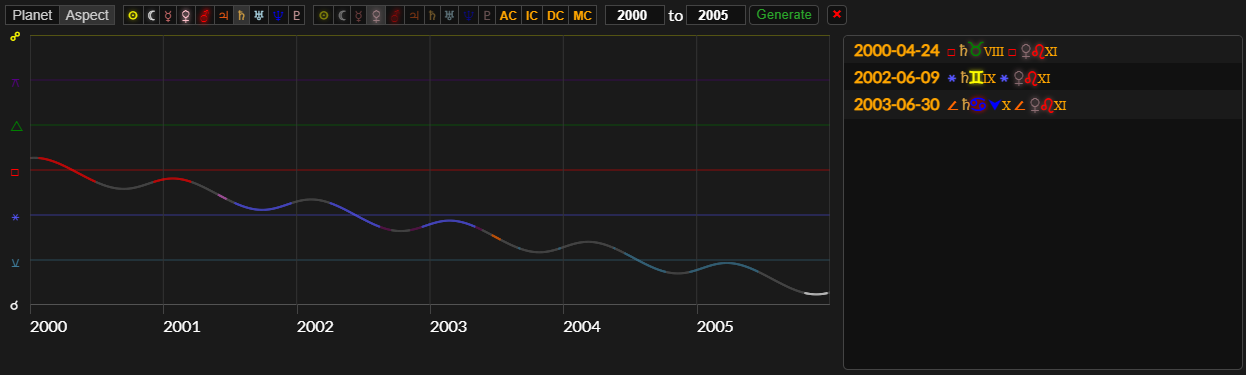
The second type of graph is the graph. With this you can select two planets and see their aspect (degrees of separation) over time. This is very useful for viewing planetary cycles and finding dates when they make aspects.
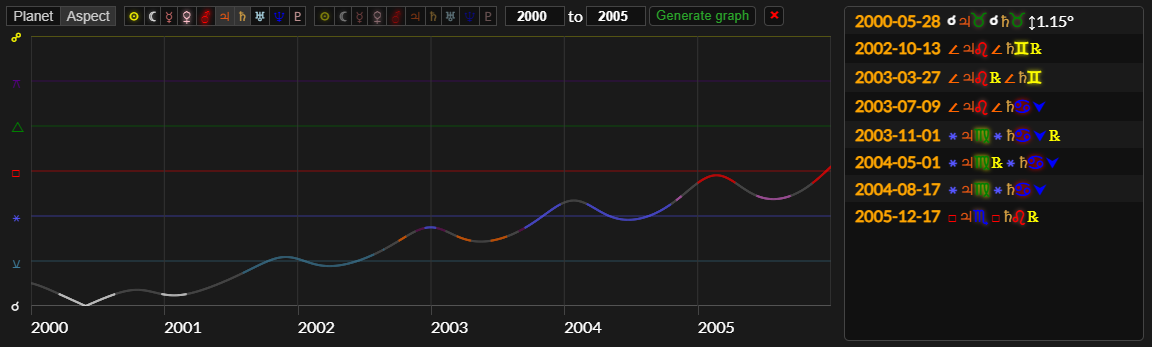
To generate a graph, first select the graph type with the buttons in the top left. You can then select which planets you want to view on the graph. If you selected to show an aspect graph it will only show the aspect line between the first two selected planets.
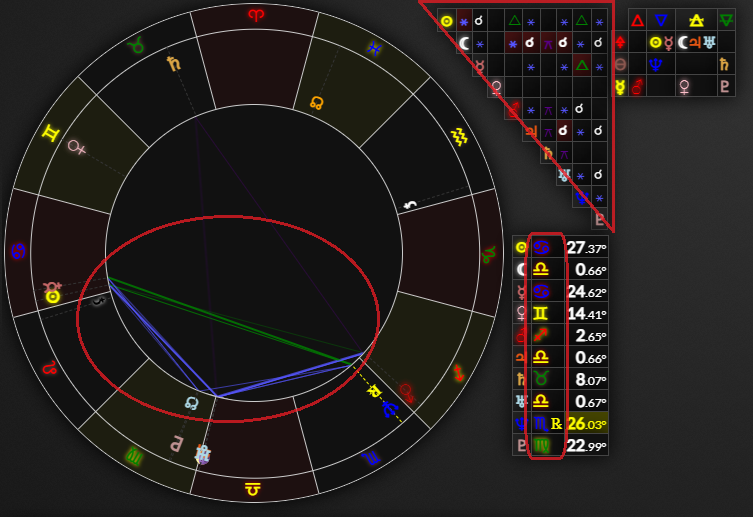
The transparent glyphs are the natal (ghost) planets, that is where the planets are in the time selected in date 1. This is useful for seeing how transiting planets are aspecting your natal planet over time and the dates that they make aspects.
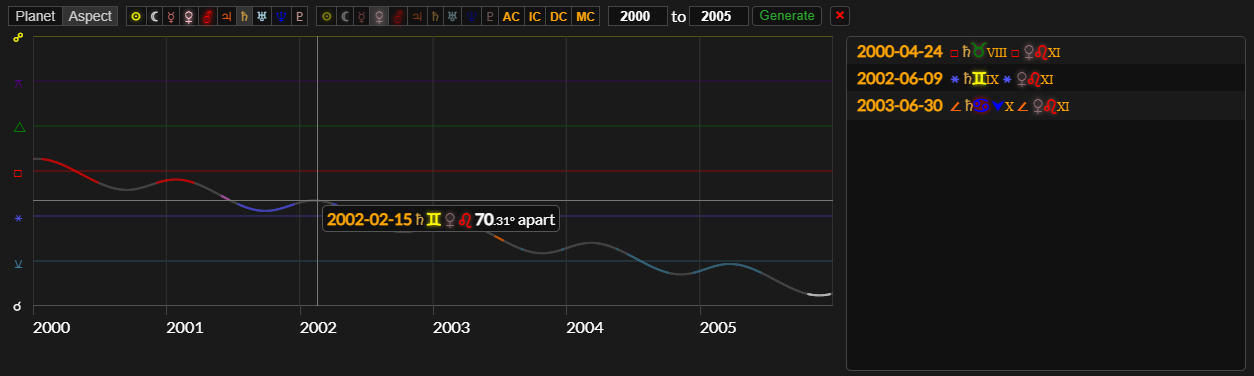
You can hover over the graph with the mouse to see the date at that point and what degree/sign the planets are in or how many degrees apart they are. If you click the graph the dates tab/astrology chart will go to that day and you can view the astrology chart for that day.
To the right of the graph is a list of all dates when selected planets change sign, station or make aspects.